Hawaii Agricultural Land Use Study Released
Posted on Feb 17, 2016 in Main, News-ReleasesNEWS RELEASE
NR16-1
Feb. 17, 2016
HONOLULU ‑ The Hawaii Department of Agriculture (HDOA) has released a study on agricultural land use which provides information on the location of commercial agriculture activities statewide. The Statewide Agricultural Land Use Baseline 2015 study updates a 1980 survey and provides current information and maps on the locations of Hawaii’s farms and ranches. The baseline study is intended to help industry, government and the community in making decisions that affect agriculture land use in the state.
The 100-page report was completed under a contract with the University of Hawaii at Hilo’s Spatial Data Analysis and Visualization Lab (SDAV) and is available on the HDOA website at: https://hdoa.hawaii.gov/salub/
“This baseline study is one of several projects we are working on to lay a foundation for measuring our progress toward increasing agricultural production statewide,” said Scott Enright, Chairperson of the Hawaii Board of Agriculture. “We look forward to using this tool in making informed decisions about current agricultural enterprises and in the planning and promoting of new agricultural investment to increase our food security.”
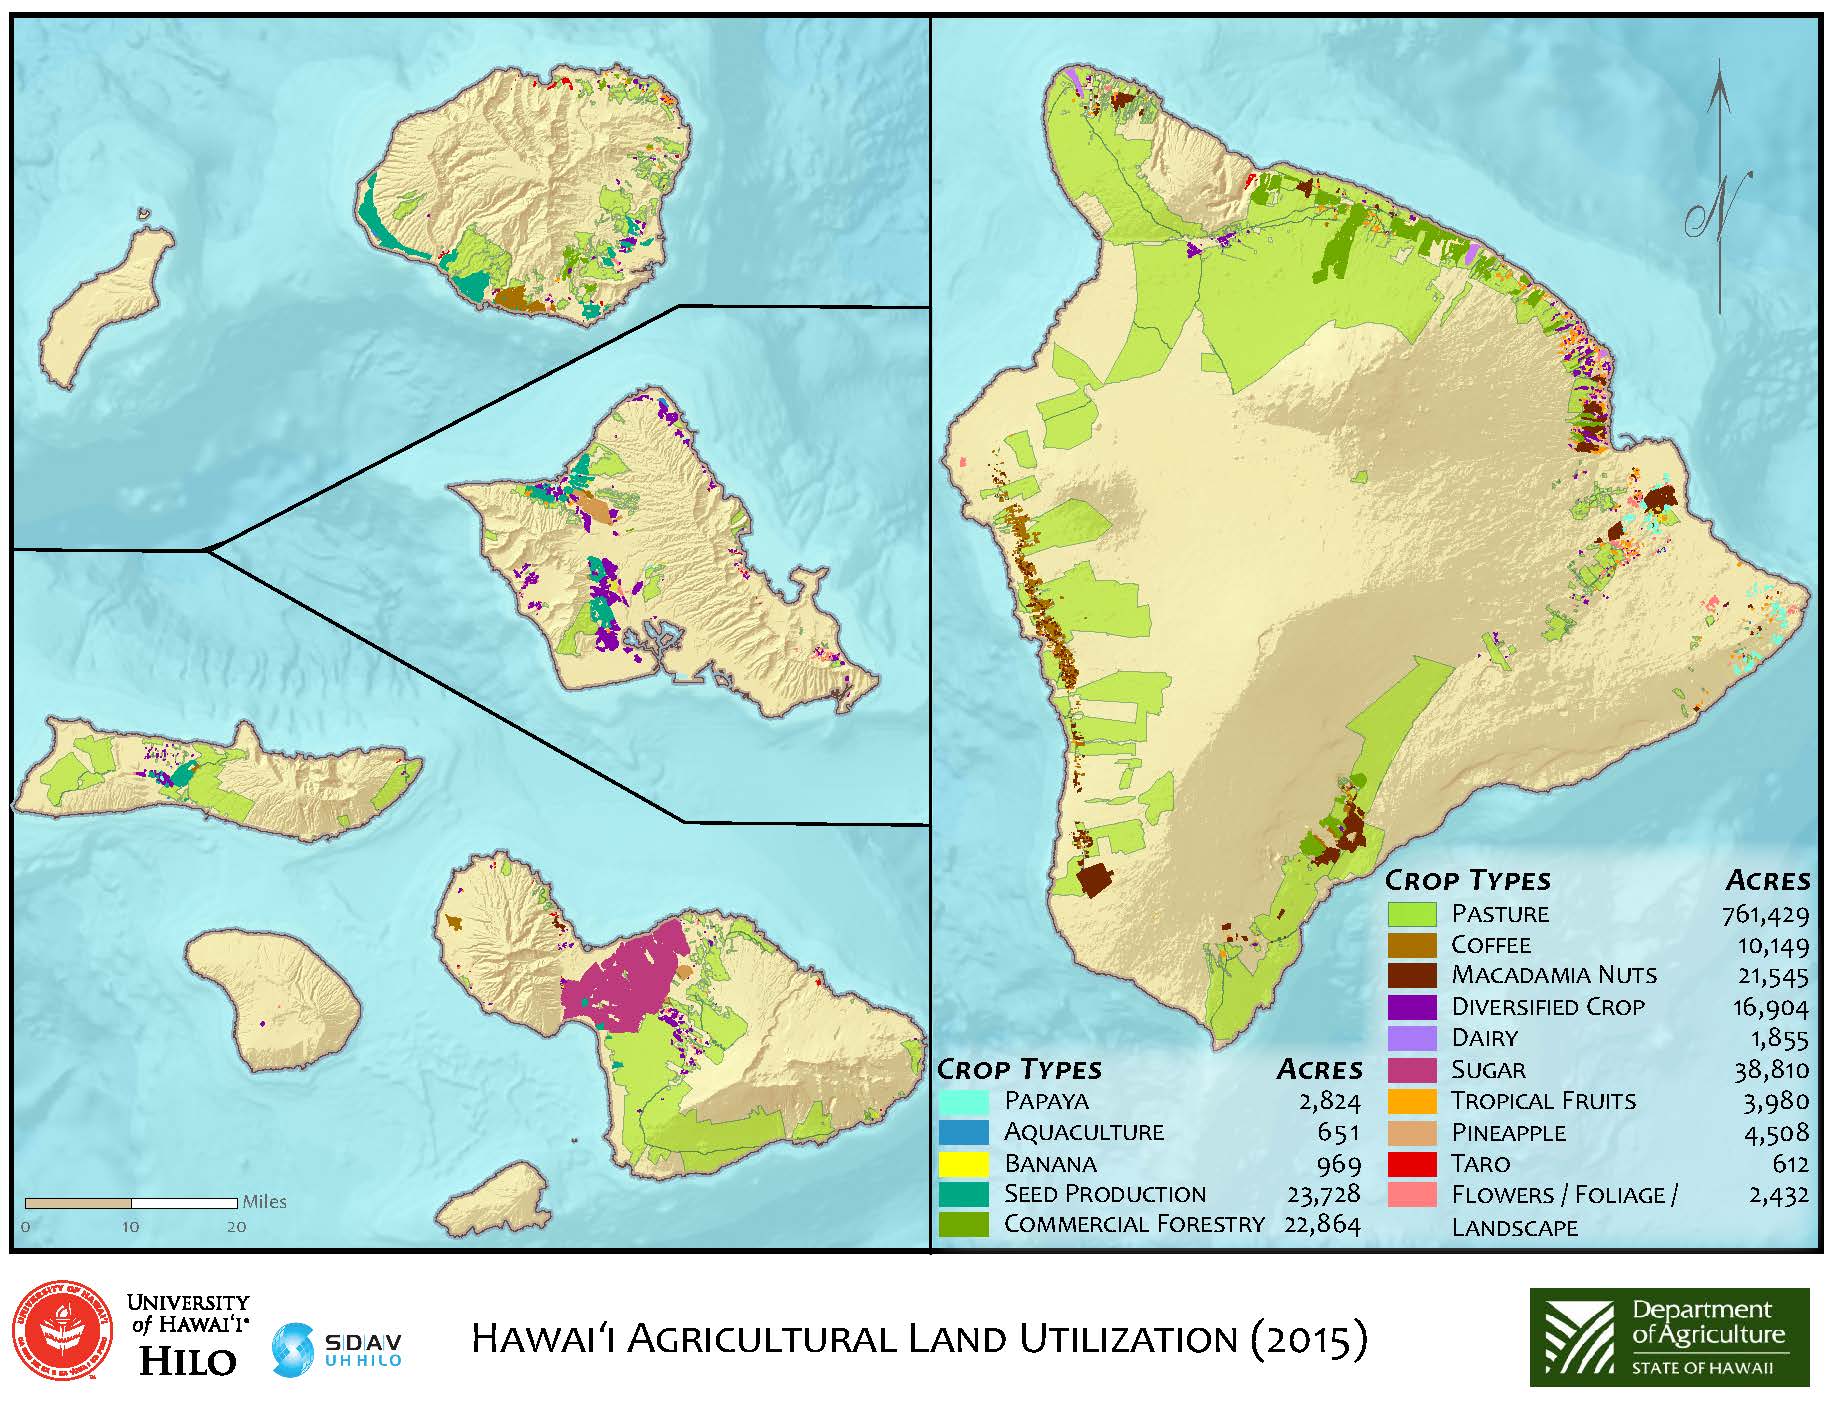
The 2015 Baseline report provides a wide range of maps and graphics depicting the location of 15 crop categories with island-by-island summaries and regional descriptions of some of the factors that drive ongoing agricultural activity around the state. It is a snap shot in time from which to measure change in agricultural land use patterns both historically and for measuring change in the future. It will also serve as a planning tool for agency, industry and community interests to think collaboratively about future directions in agriculture based on what is currently taking place on a region-by-region basis around the state.
CHANGES IN HAWAII’S AGRICULTURAL LANDSCAPE
Hawaii has been through a dramatic change in agricultural land use over the last 35 years with the passing of the plantation era in both sugar and pineapple production.
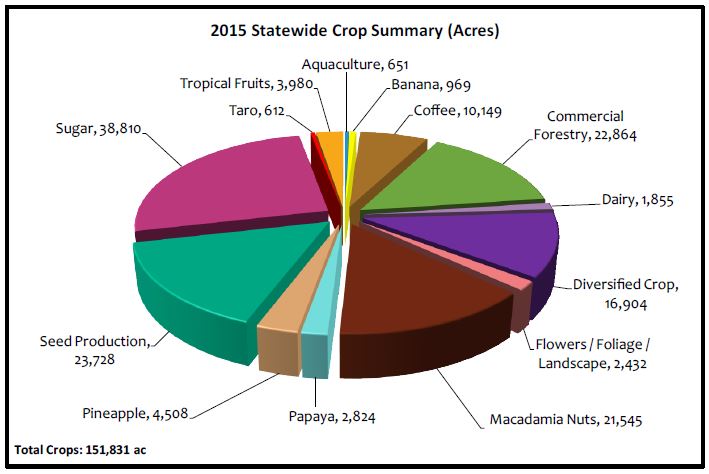
In 1980 there were 350, 830 acres in crop production, 85 percent of which was tied to sugar and pineapple. In 2015, total crop acres have dropped to just 151,830 acres with just 28 percent of that being sugar and pineapple. Each region that experienced the shutdown of plantations has responded differently. Some have seen the emergence of new crops, others have not. Understanding the pattern of this recovery process will help to better predict the trajectory of future crop production statewide.
In 2015, sugar remained the largest crop on the state with 38,800 acres and those acres will be fallowed in 2017 following the planned closing of HC&S plantation on Maui. The seed companies were the second largest land users with 23,720 acres on four islands. Commercial forestry, primarily on Hawaii Island was close behind with 22,860 acres. Macadamia nuts, again primarily on Hawaii Island, was the fourth largest crop at 21,545 acres. All of the top four crops are grown primarily for export purposes.
Diversified crops are grown on 16,900 acres statewide. This category includes a wide variety of leaf, root and melon crops, most of which is consumed locally. More than half of all diversified crops in the state are grown on Oahu and most of that in the central plain between Ewa and Haleiwa. In 1980, just 7,490 acres of diversified crops were grown statewide, indicating a substantial increase in local food production and a shift in the center of that production to Oahu where the market is the largest and transportations costs are the lowest.
The 2015 study also mapped more than 760,000 acres in active pasture use. This number is down from 1.1 million acres in 1980. This decrease is due in large part to the removal of remote lands from pasture use by land owners like Kamehameha Schools and the Department of Hawaiian Home Lands on Hawaii Island and by the acquisition of pasture properties by the National Park System and the U.S. Fish and Wildlife Service and the U.S. Army. Pasture use accounts for 83 percent of all productive agricultural land use in the state and 73 percent of that use is on Hawaii Island.
The project used Geographic Information Systems technology and aerial imagery from several sources to digitally document the footprint of lands engaged in commercial scale agriculture statewide.
- The complete report along with digital data and key maps and graphics are posted on the HDOA website at: https://hdoa.hawaii.gov/salub/
- Detailed data from the Office of Planning’s GIS library can be found here
# # #
 |
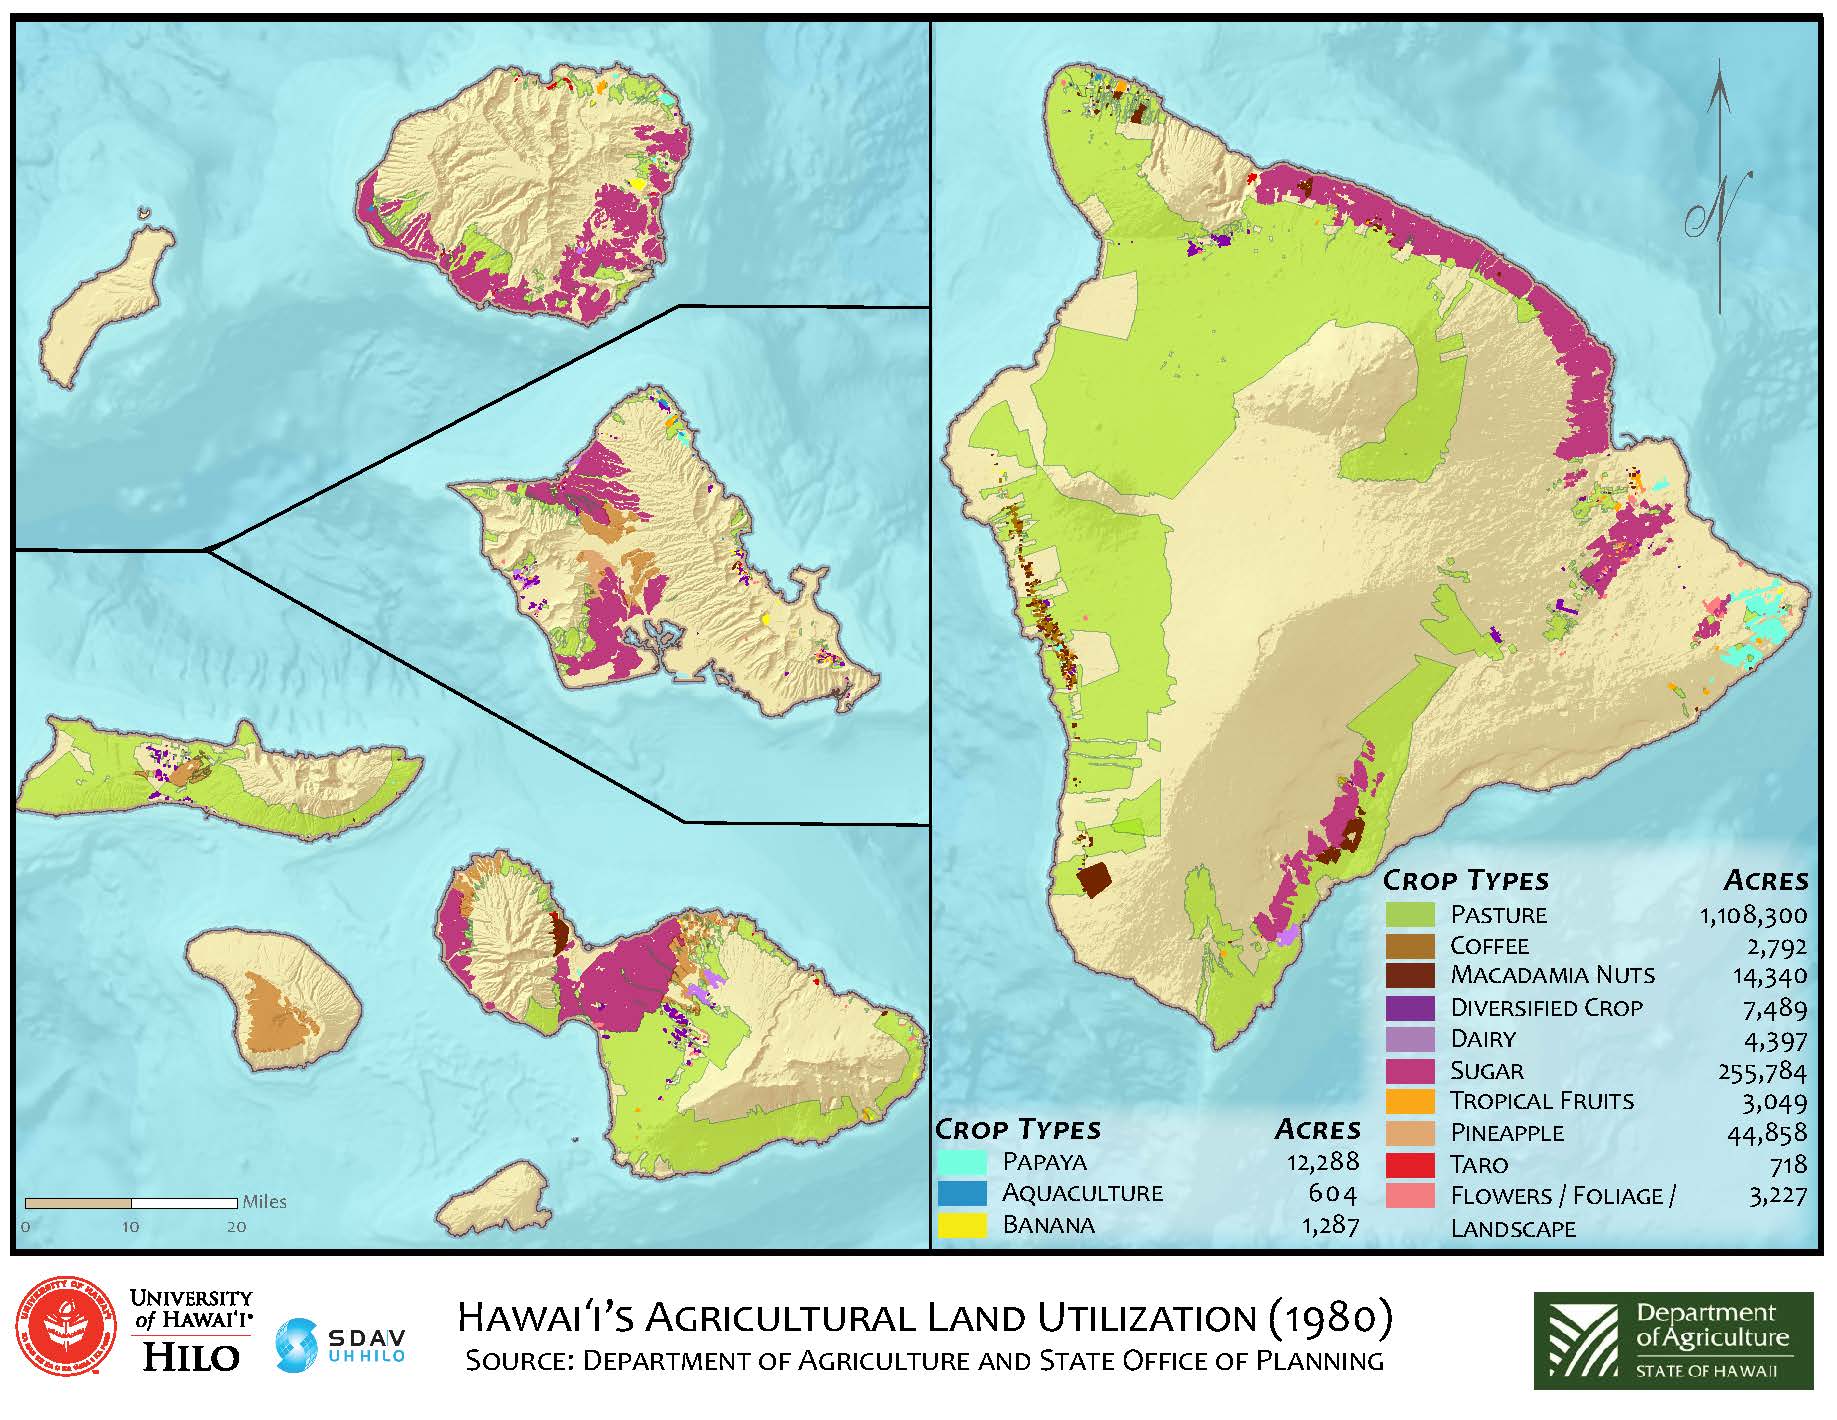 |
| Hawaii Ag Land Utilization – 2015 | Hawaii Ag Land Utilization – 1980 |
 |
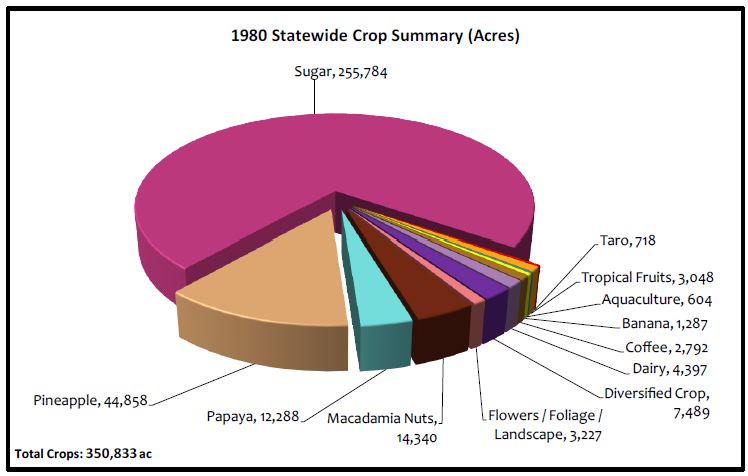 |
| Statewide Crop Summary – 2015 | Statewide Crop Summary – 1980 |